2/11/25 - Financial Waves of Early 2025: Riding the Net Fiscal Flow Rollercoaster Amid a Trade War
As the calendar flipped into February 2025, a $3.748 billion net fiscal flow streamed into the private sector. This fresh influx followed the hefty $124.667 billion in January '25 net fiscal flows. While the market seemed flush with cash, the current landscape signals the need for cautious optimism, particularly around the risky practice of naked shorting.
Navigating February's Financial Currents
Early indicators for February suggest the net fiscal flows might see more outflows than inflows. This trend appears likely to extend into March, creating a potentially tumultuous April. The fiscal scene could take a turn if DOGE makes significant spending cuts, so staying alert is essential.
Understanding the Fiscal Deficit
The discussion around DOGE's influence on the economy remains contentious. Post-election, we've witnessed the rolling deficit spike to multi-year highs. However, the narrative took a sharp turn post-inauguration, with the rolling deficit seeing a notable contraction. Our daily tracking of net fiscal flows keeps us informed about these shifts, helping us anticipate future trends. It's a stark reminder of how interconnected and dynamic fiscal policies are within our economic ecosystem.
Tariff War: An Added Layer of Complexity
The financial landscape of early 2025 isn't just about fiscal flows; it’s also being shaped by a new tariff war. The statement comes after U.S. President Donald Trump signed an executive order to impose 25% tariffs on steel and aluminum. Shares of American steelmakers rallied sharply on Monday following the order.
Tariffs are effectively a tax paid to import a good into a country. The latest tariffs could raise the price of foreign steel, and thereby help to support U.S. steel producers at the expense of international competitors. Von der Leyen called tariffs “bad for business, worse for consumers.”
Trump has taken an aggressive approach with tariffs early in his second tenure in the White House. He has already ordered tariffs on China, Canada, and Mexico. The Canada and Mexico tariffs have since been delayed one month. Europe is not alone in pushing back against the U.S. tariffs. Last week, China announced new levies against select U.S. imports.
In Conclusion
As always, the financial world requires a balanced approach between opportunity and risk. While cash and hedging strategies are generally safer, naked shorting remains precarious. With the added layer of tariff-induced complexity, staying vigilant and informed is more crucial than ever. The evolving fiscal terrain, marked by net fiscal flows and trade disputes, calls for a cautious yet proactive approach to navigate these uncertain waters.
2/10/25 - Expanding Manufacturing and services PMI’s
Green shoots in Jan 2025
Strong ISM Data Signals Economic Optimism
The latest ISM data for January 2025 has brought some encouraging news for the U.S. economy. The Manufacturing PMI rose to 50.9%, marking the highest level since September 2022. This indicates expansion in the manufacturing sector after 26 consecutive months of contraction. The Services PMI also showed growth at 52.8%, marking the 10th out of the last 12 months of expansion.
Sector Performance Highlights
The strongest sectors based on the ISM reports include:
Accommodation & Food Services 2. Finance & Insurance 3. Food, Beverage & Tobacco Products 4. Health Care & Social Assistance 5. Mining 6. Petroleum & Coal Products 7. Primary Metals 8. Textile Mills
On the other hand, the weakest sectors are: 1. Fabricated Metal Products 2. Nonmetallic Mineral Products 3. Other Services 4. Printing & Related Support Activities 5. Professional, Scientific & Technical Services 6. Real Estate, Rental & Leasing 7. Utilities 8. Wood Products
Currency and Bond Market Insights
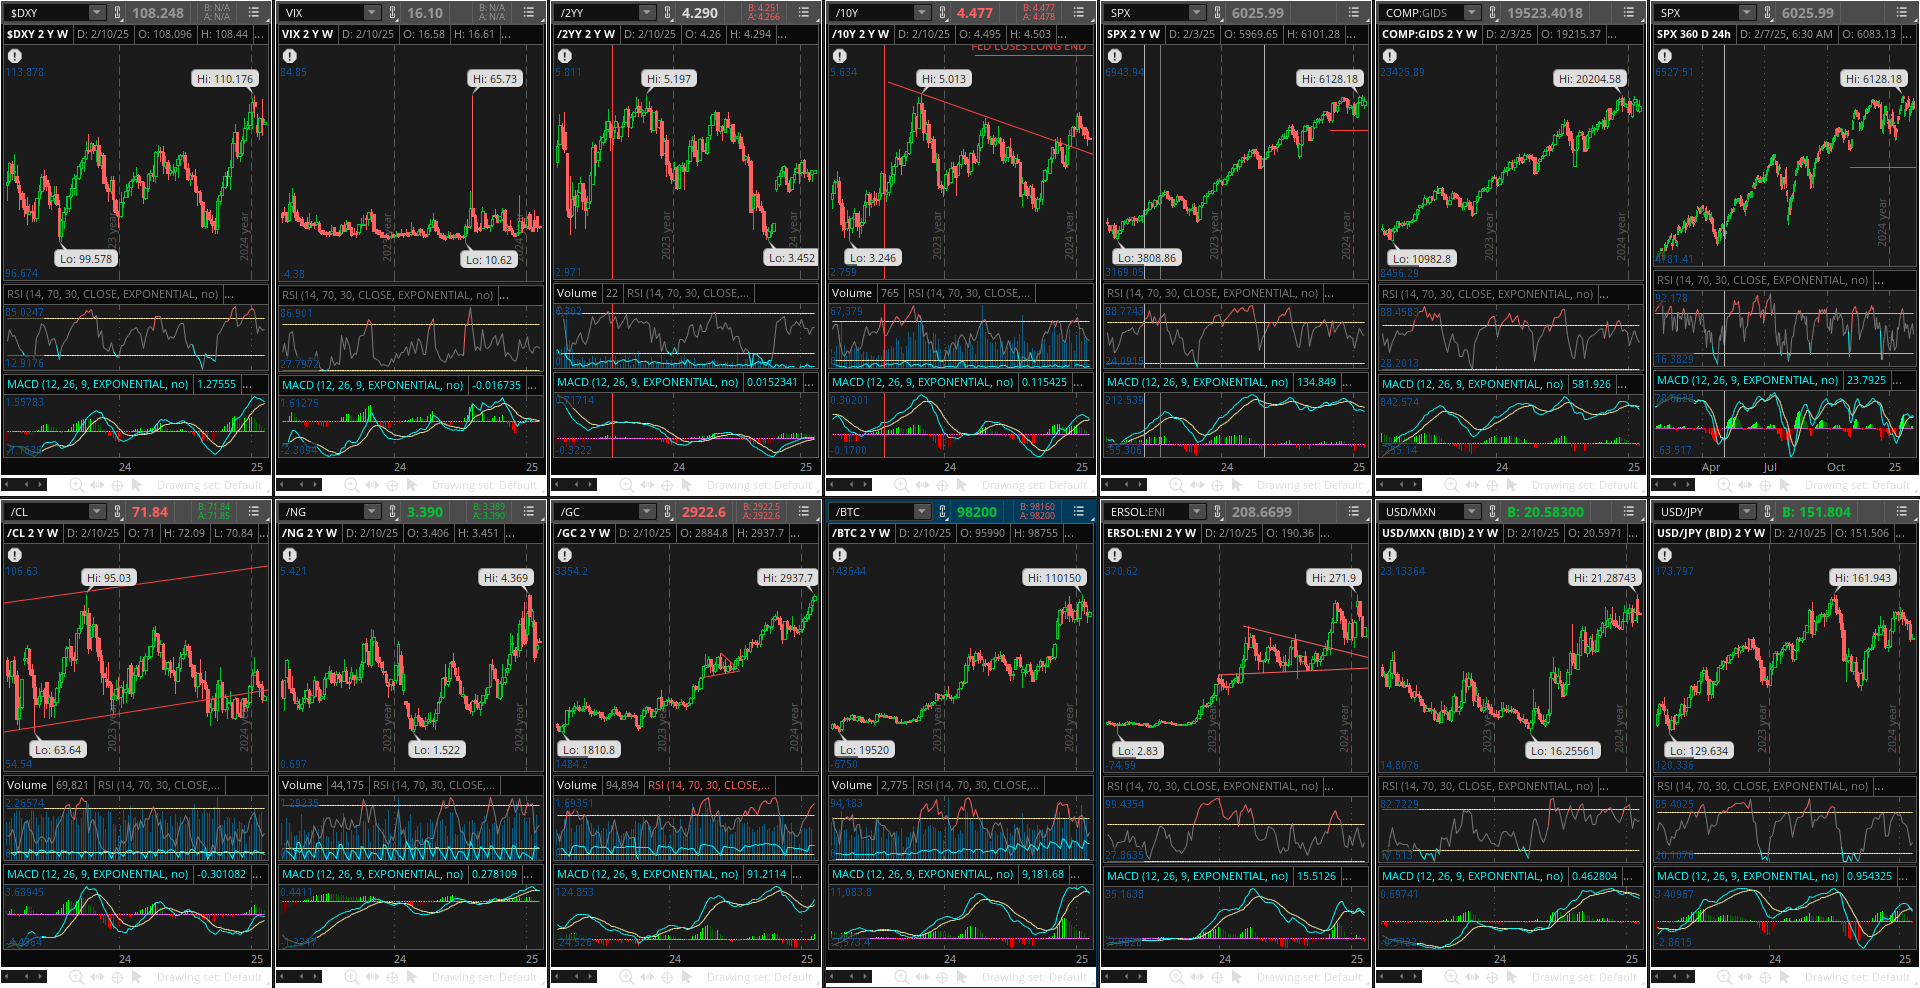
The DXY (USD index) is currently at 108.184, down from a recent high of 110.176 on January 13th, 2025. The upward momentum in the USD appears to have finished, with many analysts predicting a potential decline back to 105. The US 10-year yield is at 4.472%, down from a recent high of 4.809% on January 14th, 2025. The upward momentum in yields also seems to have stalled.
Equity Market Trends
The S&P 500 and Nasdaq 100 show signs that their upward momentum has broken. Despite this, net fiscal flows from the treasury into the private sector remain strong, leading some investors to buy the dips in growth. The weekly MACD for these indexes has bearishly crossed from positive to negative.
Commodities and Cryptocurrencies
WTI crude oil has seen its momentum slow, but the weekly MACD remains positive for now. Natural gas is expected to see its weekly MACD bearishly cross from positive to negative soon. Gold has bullishly crossed over on the weekly MACD, although it is already overbought on the weekly RSI. Bitcoin and Solana, along with other cryptocurrencies, have seen their weekly MACD bearishly cross from positive to negative.
Forex Market Outlook
The USD looks poised to weaken against many currencies, making timing crucial for forex traders.
1/25/2025
It all begins with an idea.
I am raising cash.
I am convinced the market is at an inflection point in 1Q25 where the interest rates have risen significantly since the US presidential election in early November. The 10-year yield is up +5.53% and SPX is up +6.5% since November 1, 2024. Cash is now yielding 4.33%, the 10-year yield is 4.62%, and the 2-year yield is 4.272%.
This move in yields hasn’t been priced in to equities, and the big risk is the 10-year yield heads to 5.5% clearly hasn’t been taken seriously. Tactically I’m short a tiny bit of the S&P 500 via $SH.
I’m already max long in crypto so that’s my beta. I don’t imagine getting more than 1 good buying opportunity in 2025.
The trades I’m eyeing for the immediate- to medium-term involve shorting equities and buying 2-year treasuries. This may also coincide with shorting the 10-year treasury. The cash I am raising from selling equities will fund the long $SHY trade. All new income will go to $SHY.
I don’t own any $SHY yet. I would open a position if the 2-year yield got to 4.5%, or when the daily and weekly RSI get overbought. The last time that happened, you could have locked in a 2-year yield of 4.8-4.9%.
Weekly Charts for macro assets. DXY, Yields, Equities, Gold, Bitcoin all look vulnerable.
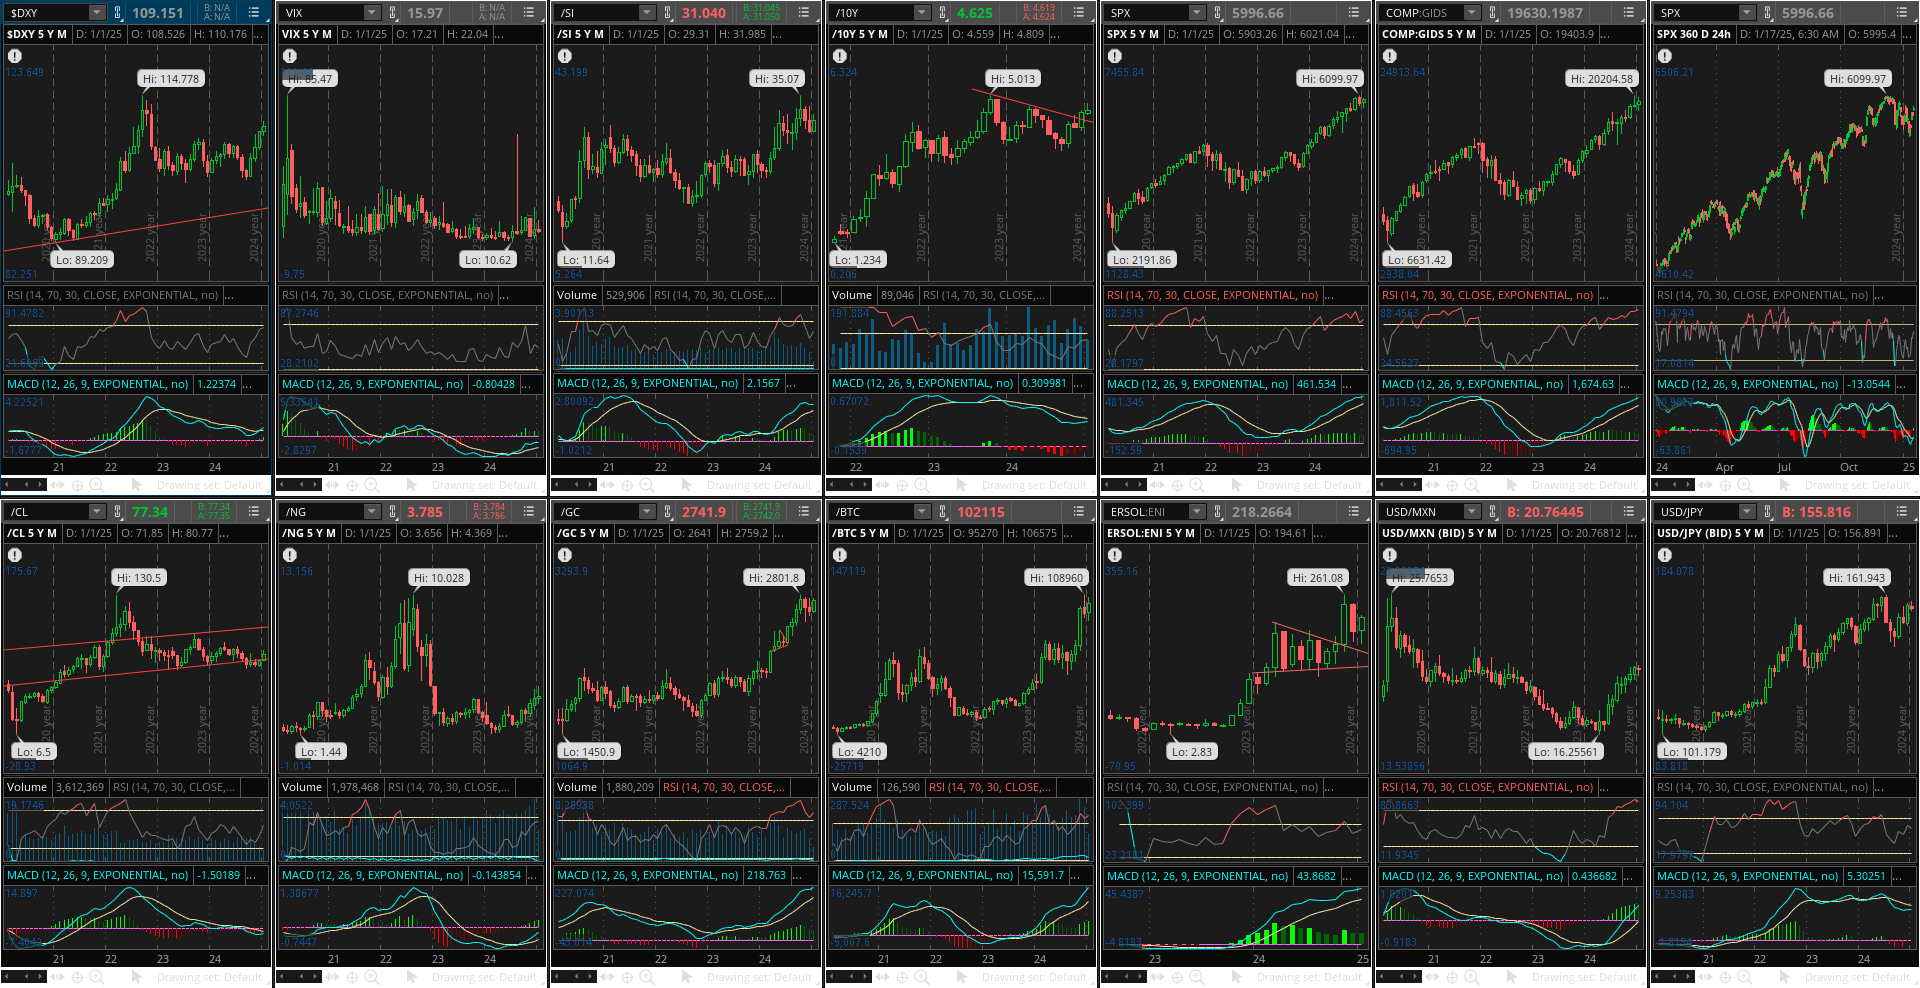
Monthly chart for macro assets. Long-term trends are nearing inflection points in the DXY, Yields, Equities, Gold, and Bitcoin.
January 19th, 2025
It all begins with an idea.
Macro Asset Analysis: Navigating a Sea of Uncertainty
January 19, 2025, has arrived, and the financial markets remain as volatile as ever. Looking at my technical analysis charts, I see a mixed bag of signals across a range of key assets.
Let's dive in:
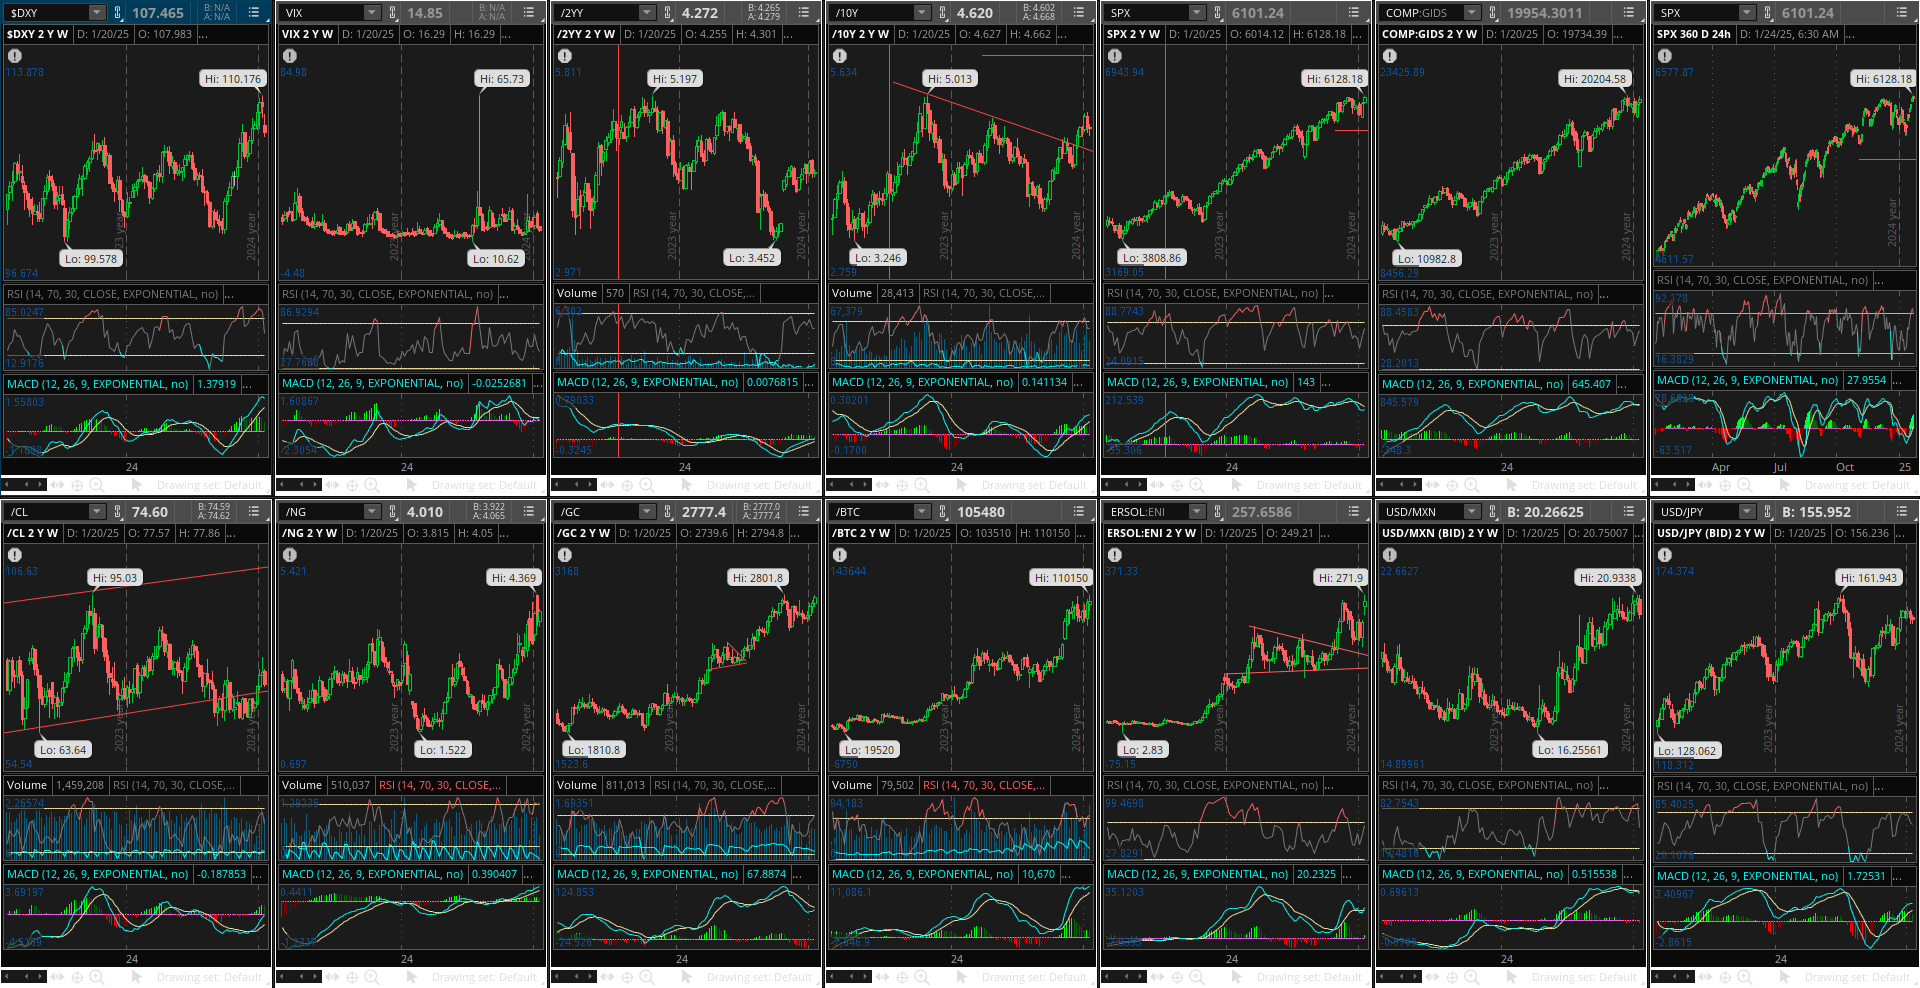
USD Index (DXY): On the monthly chart, DXY shows a bullish MACD crossover, suggesting potential for further upside. However, zooming in on the weekly chart reveals a picture of potential overbought conditions, hinting at a possible pullback.
10-Year Treasury Yield: The 10-year yield is approaching a bullish MACD crossover on the monthly chart, which could signal rising interest rates.
Commodities: Crude Oil (WTI) appears close to a bullish MACD crossover on the monthly chart. Meanwhile, Natural Gas has already experienced a bullish crossover and has been steadily trending upwards since August 2024.
Equities: The equity markets are sending mixed signals. The weekly chart for the NASDAQ suggests a potential bearish MACD crossover, but it's too early to say if this is a significant reversal.
Cryptocurrencies: Solana initially showed a bearish MACD crossover on the weekly chart, but the launch of $TRUMP has reversed this trend, leading to a bullish crossover.
the strong dollar is a significant concern, and a Plaza Accord-like agreement could be a potential solution in the future. Let's break down the key points:
Why a Strong Dollar is a Concern:
Trade Imbalances: A strong dollar makes US exports more expensive and imports cheaper, leading to trade deficits.
Loss of Competitiveness: US manufacturers and exporters face challenges competing in global markets due to the high cost of their products.
Job Losses: This can lead to job losses in manufacturing and other export-oriented industries.
The Plaza Accord:
History: The Plaza Accord was a 1985 agreement between the US, France, Germany, Japan, and the UK to coordinate currency intervention and depreciate the US dollar.
Success: The agreement was successful in weakening the dollar and reducing US trade deficits.
The Need for a Similar Agreement:
Rising Trade Tensions: The current trade tensions between the US and other countries could lead to further appreciation of the dollar.
Global Imbalances: The US still runs a large trade deficit, and a strong dollar exacerbates this problem.
Limited Policy Options: Traditional monetary policy tools may not be sufficient to address a strong dollar in the current global economic environment.
Potential Challenges:
Coordination: A new Plaza Accord would require coordination among major economies, which can be difficult to achieve.
Market Resistance: Currency markets are highly volatile, and market participants may resist coordinated intervention efforts.
Unintended Consequences: A rapid depreciation of the dollar could lead to inflation and other economic problems.


